Welcome to another edition of the Meet the Metric series, in which we introduce and show you how to use a specific advanced metric here at PlayerProfiler. Today we will be looking at Target Quality Rating. This metric helps us to describe the targets a WR gets. We will see why it is worthwhile to incorporate this metric into our analyses, take a look at who benefitted and struggled last season, and finally consider how to apply it to the upcoming season.
Definition
As the invaluable Terms Glossary puts it, Target Quality Rating seeks to combine catchable target percentage with average target depth into one metric to judge the quality of the targets a WR receives. In a traditional box score, you can see how many targets a WR receives. We know all targets are not created equally, however. Through our film grading process, targets are judged to be catchable or not via Catchable Target Rate. Using that, we can then assess how many of a WR’s targets were catchable. That gives us a baseline from which to compare performances. Two WRs each with a 50-percent Catch Rate may actually be performing differently if one has a 60-percent Catchable Target Rate vs the other at 40-percent.
Incorporating whether the targets were catchable is a good first step to judging a WR’s situation and performance. We need to do more when we want to analyze the value of the targets from a fantasy football perspective. After all, we care about fantasy points, not Catch Rate. We can take this a step further then by incorporating the average depth of those targets as well. The further down the field a target is, the more potential fantasy points can be had. Suppose two WRs each have a 75-percent Catchable Target Rate. If one is targeted on average 12 yards down the field while the other is at six, the first WR will likely be scoring more fantasy points.
Target Quality Rating allows us to combine those two measures (Catchable Target Rate and Average Target Distance) into one number that we can use to judge the value of the targets that WR receives.
2020 Example
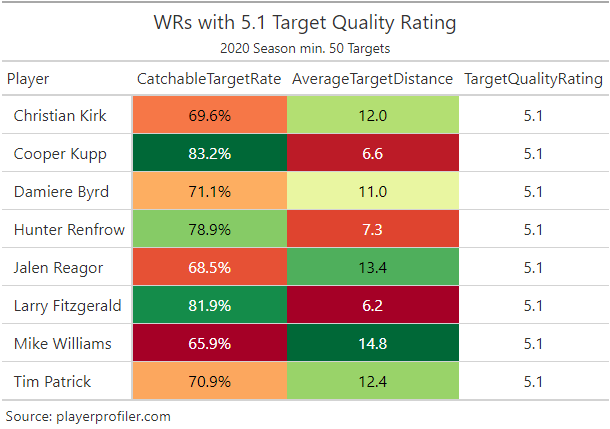
Let’s analyze a particular group of WRs in 2020 to make this more concrete. Using a minimum target threshold of 50, there were eight WRs who had a Target Quality Rating of 5.1.
This group of WRs runs the whole spectrum from deep threats to slot WRs. By weighting Catchable Target Rate by Average Target Distance, we see different WRs who are in similar per-target situations for scoring fantasy points. Cooper Kupp has a remarkably high 83.2-percent (No. 17 among qualified wide receivers) Catchable Target Rate. Those targets came with a 6.6 (No. 103) Average Target Distance. He is likely to convert his targets into receptions. From a fantasy perspective, each individual reception is not generating significant fantasy point-scoring opportunity.
Conversely, Mike Williams has a low 65.9-percent (No. 100) Catchable Target Rate on a 14.8 (No. 9) Average Target Distance. He’s the opposite of Kupp. Williams is not nearly as likely to catch every target he receives, but when he does, they are likely to generate more fantasy points due to being deeper down the field. Those deeper receptions rack up more yards and more touchdowns. These two players play differently, but their per-target opportunity is the same through the lens of Target Quality Rating.
2020 Leaders
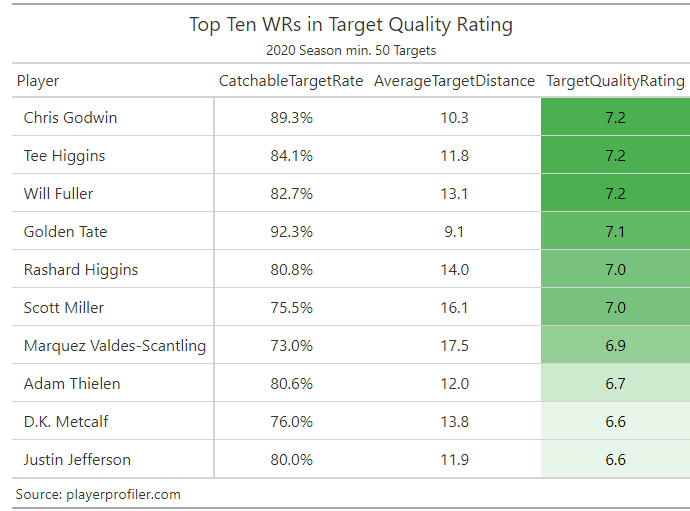
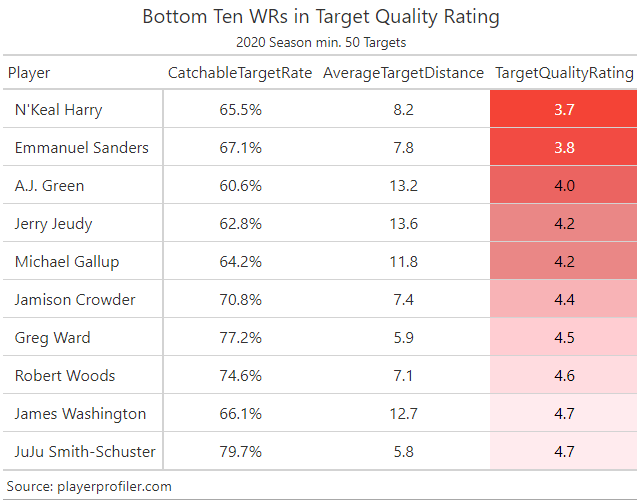
Now that we understand the metric, let’s look at who was in the best and worst situations in 2020 from a Target Quality Rating perspective. The top 10 include some of fantasy football’s best WRs, evidence that when combining valuable targets with quantity, fantasy points will follow.
It’s interesting to note that two Tampa Bay WRs are featured in this list. Tom Brady still has it in case you were wondering. Also present are both of Minnesota’s top WRs. In a run-first offense, they both require efficiency in the targets they receive. Rounding out the list are a few deep threat WRs who were fortunate to be paired with accurate deep throw passers in Will Fuller, Rashard Higgins, and Marquez Valdes-Scantling. The return of Aaron Rodgers was crucial for MVS, and switching to Tua Tagovailoa may hurt Fuller.
On the other end of the spectrum, we see WRs who stick close to the line of scrimmage, and ones languishing on offenses with poor QB play. The former consists of the likes of Greg Ward, JuJu Smith-Schuster, and Robert Woods. The latter included Jerry Jeudy, Michael Gallup, and N’Keal Harry. Hopefully QB upgrades for Woods, Jeudy, and Gallup can create a boost for these WRs this year.
Looking Ahead
So far, our analysis using Target Quality Rating has been descriptive in that we have been looking at the past to understand what happened. In fantasy though, the most important week or season is always the next one, so let’s figure out how to use this metric in a predictive sense.
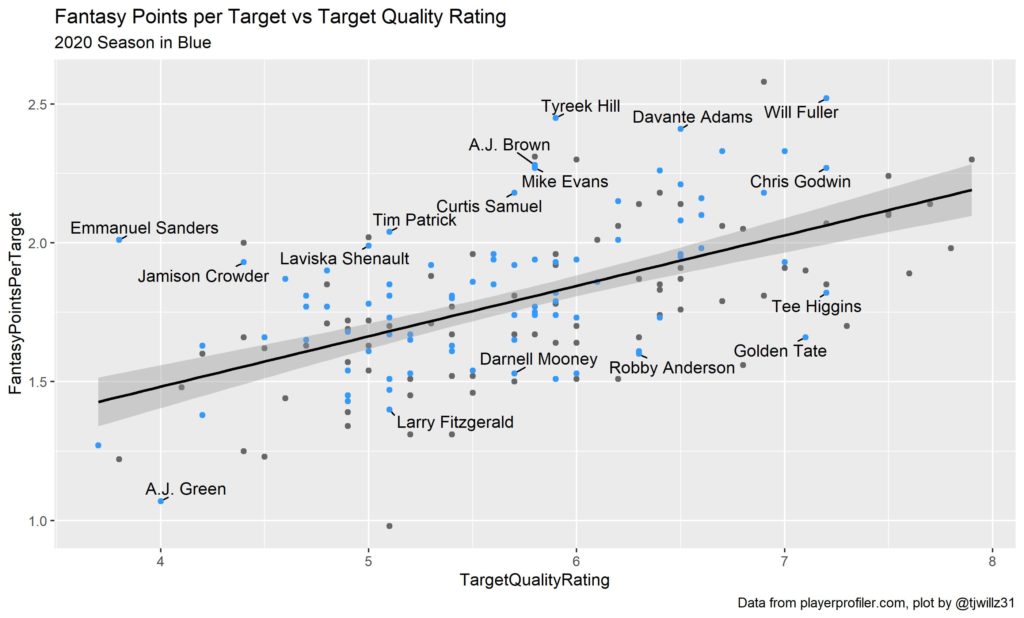
Target Quality Rating describes how valuable each target a WR was on average. It does not take into any consideration what the WR was actually able to do with those targets. This dichotomy allows us to compare expected performance vs realized performance. The plot below shows the Target Quality Rating on the X (horizontal) axis and the Fantasy Points Per Target on the Y axis for 2019 and 2020 among WRs with 50 or more targets in that season. As expected, the higher the Target Quality Rating, the higher the Fantasy Points Per Target average tends to be. The line through the middle represents the Fantasy Points Per Target an “average” player would achieve given a particular Target Quality Rating. I’ve highlighted players notably above or below the line in 2020.
Those above the line overperformed their situations in 2020. They averaged more Fantasy Points Per Target than expected. At first glance, we see some of the league’s brightest stars with Davante Adams, Tyreek Hill, A.J. Brown, and Chris Godwin.
We can be confident that these players will continue to overperform relative to an average player based on their track record of demonstrated talent.
That same confidence is not there for other overperformers for which the sample isn’t as large. It is encouraging to see Laviska Shenault, Tim Patrick, and Curtis Samuel all overperforming in 2020. The question is whether that is a sign of their talent or whether they hit the right side of variance and may regress in 2021. Luckily for all three, QB upgrades this year may make this a non-point. Any dip in their performance may be outweighed by the gain in target quality. All three are strong buys, particularly Shenault.
On the other hand, there are those below the regression line that underperformed their situations in 2020. Unsurprisingly we see some older players in the latter stages of their careers like Golden Tate, Larry Fitzgerald, and A.J. Green. Expecting a bounceback is not wise. Stay away. The most interesting players in this plot are Tee Higgins and Darnell Mooney. Higgins and Mooney were rookies last year and have generated significant redraft and dynasty buzz. However, they left a lot points on the field. A positive mean reversion is absolutely possible; we should not write off rookies who flashed in Year 1, but this does serve as a bit of cold water on those hype trains.
Conclusion
Wrapping up, in this article we introduced the Target Quality Rating metric. We explained why combining Catchable Target Rate with Average Target Distance gave a more true description of a WR’s per-target situation for scoring fantasy points. We highlighted the top and bottom players last season. Finally, we used it to create an expectation for Fantasy Points Per Target allowing us to compare which players over and underperformed their situation in 2020 with an eye for potential regression (positively or negatively) in 2021. If you stayed with me through all of that, you’re now ready to get out there and better analyze how WRs are set up to score their fantasy points. Good luck this year.

