A lesson learned by myself and many during NFL offseasons is to trust an NFL team’s actions, not words. As mentioned on the debuting episode of The Decision Point on Rotounderworld Radio, the Rams will say that they aren’t looking to add a running back in the wake of Cam Akers‘ season-ending Achilles injury.
We know that isn’t true. They will add a running back between now and the start of the season. I reiterate, trust a team’s actions, not their words.
Draft capital is basically a film grade provided for free by NFL scouts
Thank you for coming to my TED talk
— Santiago Casanova (@BrotoFFCasanova) July 25, 2021
The NFL Draft is the ultimate litmus test for what teams believe about the positions on their roster. Let’s use the Rams as an example, again. One season after trading picks No. 94 and No. 99 in the 2019 NFL Draft for pick No. 70 to select Darrell Henderson, the Rams selected Akers with the No. 52 pick in the 2020 NFL Draft.
Off-topic, stop over-drafting Henderson. That’s a great way to lose your fantasy football leagues before the season even starts. A question does arise from the Henderson draft pick though.
Historically, what does it tell us when a team trades up for a running back in the NFL Draft?
Background
Credit for the idea for this article goes to PlayerProfiler’s and BreakoutFinder’s Director of Analytics, Josh Larky, and J.J. Zachariason’s Late-Round Podcast episode No. 504: Utilizing Front Office Decision-Making.
I have pulled up the past 10 NFL drafts before the 2021 NFL Draft and recorded every running back picked in the top-100. I’ve noted which running backs were acquired by a team trading up.
In total, 72 running backs were chosen by NFL teams in the NFL Draft from 2011-2020. Of those 72, three (Mikel Leshoure, Ryan Williams, and Derrius Guice) will be omitted on account that they did not play their rookie seasons due to injury.
17 of the 69 (24.6-percent) were selected by teams trading up in the NFL Draft. I’ve documented all 69 running backs’ total touches, touches per game, and PPR Fantasy Points Per Game during their rookie seasons.
Goal
In 2021, Javonte Williams and Trey Sermon were drafted by NFL teams that traded up to select them. The purpose of this analysis is to see if trading up for running backs impacts their fantasy football production during their rookie seasons.
Experiment No. 1:
Trade-Up RBs Compared To Non-Trade Up RBs (Rounds 1-3)
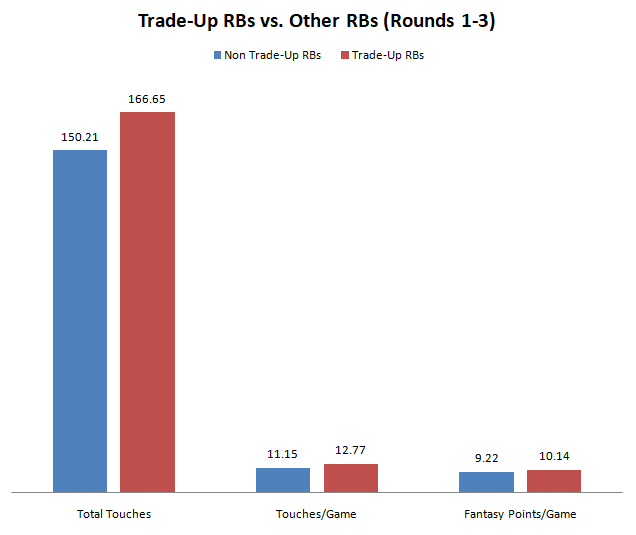
Running backs that were not traded up for averaged 150.21 touches during their rookie seasons. They averaged 11.15 touches per game and 9.22 Fantasy Points Per Game. When compared to these running backs, trade-up backs fared better across the board.
The 17 trade-up running backs saw an average of 166.65 touches during their rookie seasons. On a per-game basis, trade-up backs averaged 12.77 touches and 10.14 Fantasy Points Per Game.
Experiment No. 1 Findings
The first experiment results confirmed what we assume on the surface; teams who trade up for Day 1 or Day 2 RBs will play these players more. But let’s dive deeper into the numbers. Let’s compare running backs by the round they were drafted.
Let’s try to identify areas where trade-ups matter and don’t matter.
Experiment No. 2:
Trade-Up RBs Compared to Non-Trade Up RBs By Round Drafted
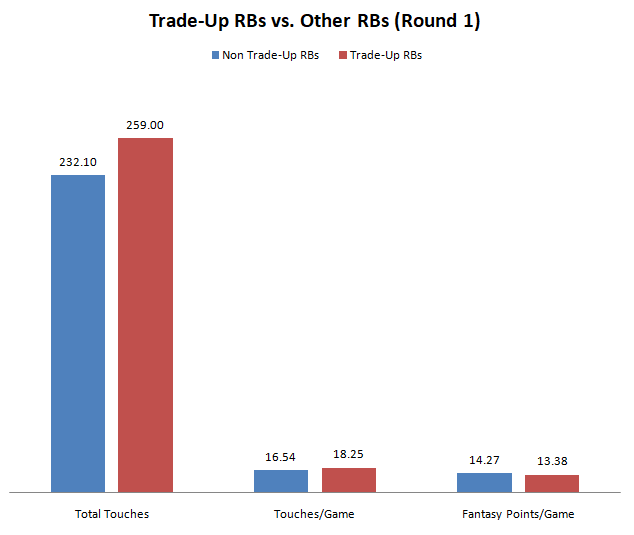
There were 14 total running backs drafted in the first round between 2011-2020. Of those 14, four were drafted by teams that traded up. Those four backs averaged 259.0 touches during their rookie seasons. On a per-game basis, they averaged 18.25 touches and 13.38 Fantasy Points Per Game.
Their counterparts in the first round averaged 232.1 touches during their rookie seasons. They averaged 16.54 touches per game on a per-game basis, but averaged more Fantasy Points Per Game with a 14.27 mark.
The second round is where we had three rookie running backs miss their rookie seasons with injuries. Disregarding those three, 26 were drafted in the second round from 2011-2020.
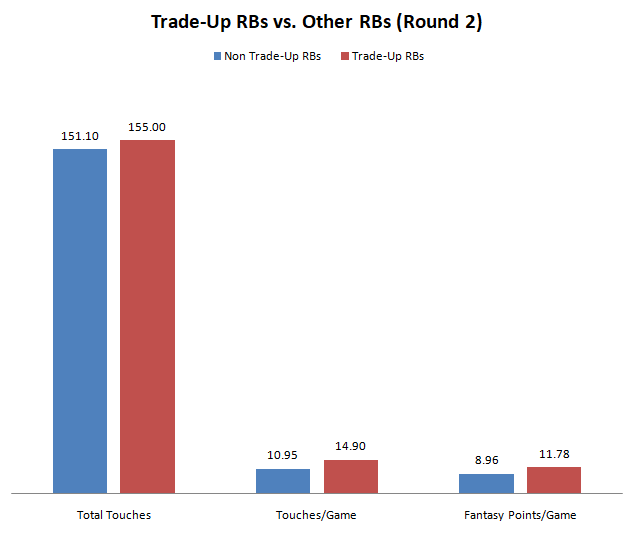
Of those 26, five were drafted by teams that traded up. The five trade-up backs averaged 155.0 touches during their rookie seasons. They averaged 14.90 touches and 11.78 Fantasy Points Per Game.
Their second-round counterparts averaged 151.1 touches during their rookie seasons and averaged 10.95 touches with 8.96 Fantasy Points Per Game
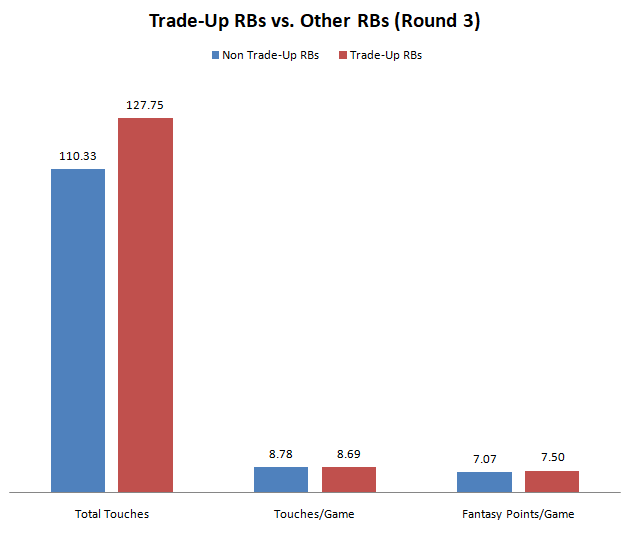
There were 29 total running backs drafted in the third round between 2011-2020. Of those 29, eight were picked by teams that traded up. The eight backs averaged 127.75 touches during their rookie seasons. They averaged 8.69 touches and 7.50 Fantasy Points Per Game.
Their third-round counterparts averaged 110.33 touches during their rookie seasons and averaged 8.78 touches with 7.07 Fantasy Points Per Game.
Experiment No. 2 Findings
The third round of NFL Drafts did not show much difference between trade-up running backs and other backs drafted in the third round. Also, first-round trade-up backs saw more touches, but fewer Fantasy Points Per Game.
That can be explained by running backs drafted at the top of the first round profiling as better fantasy football backs (i.e. Saquon Barkley and Ezekiel Elliott), as J.J. Zachariason mentioned on his podcast.
The second-round results are intriguing. Trade-up running backs in the second round averaged four more touches and three more Fantasy Points Per Game. To find the sweet spot for Day 2 trade-up backs, I’m breaking the second and third rounds into two halves (a top and bottom half of each round of Day 2).
For instance, the second round will be divided into picks No. 33-48 and picks No. 49-64, while the third round will be divided into picks No. 65-80 and No. 81-100.
Experiment No. 3:
Second Round Trade-Up RBs Compared to Second Round Non-Trade Up RBs By Half-Round Drafted
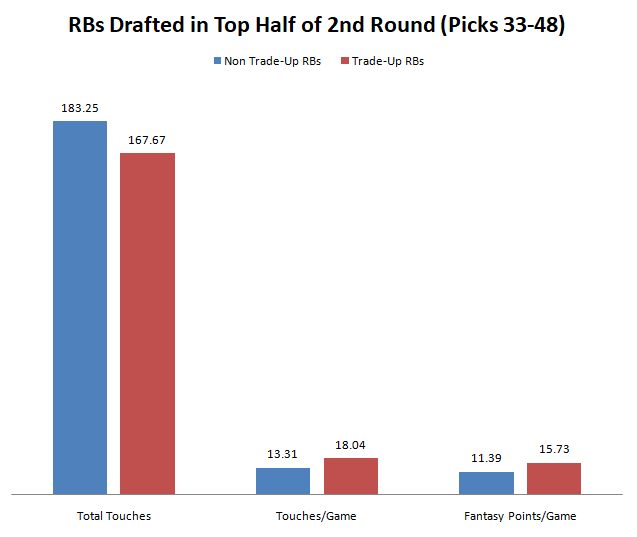
There were 11 running backs drafted in the top half of the second round (picks No. 33-48) from 2011-2020. Of those 11, three were picked by teams that traded up. The three backs averaged 167.67 touches during their rookie seasons. They averaged 18.04 touches and 15.73 Fantasy Points Per Game.
Their counterparts from the top half of the second round averaged 183.25 touches during their rookie seasons and 13.31 touches with 11.39 Fantasy Points Per Game.
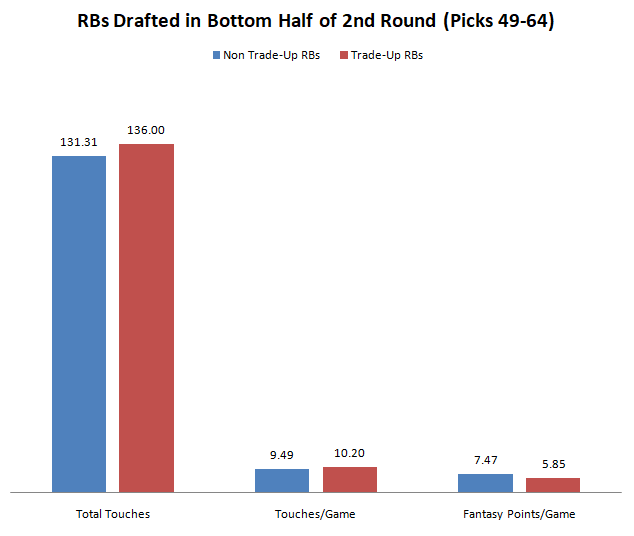
15 running backs were drafted in the bottom half of the second round (picks No. 49-64) from 2011-2020. Of those 15, two were chosen by teams that traded up. The two backs averaged 136.0 touches during their rookie seasons. They averaged 10.20 touches and 5.85 Fantasy Points Per Game.
Their counterparts from the bottom half of the second round averaged 131.31 touches during their rookie seasons and 9.49 touches with 7.47 Fantasy Points Per Game.
Experiment No. 3 Findings
The sweet spot for trade-up backs has been identified.
Running backs that teams trade up for in the top half of the second round have remarkable fantasy football success and immediate opportunities.
The three backs each averaged at least 15.0 touches and 13.9 Fantasy Points Per Game. Each RB has finished as a top-20 fantasy back during their rookie season.
Experiment No. 4:
Third Round Trade-Up RBs Compared to Third Round Non-Trade Up RBs By Half-Round Drafted
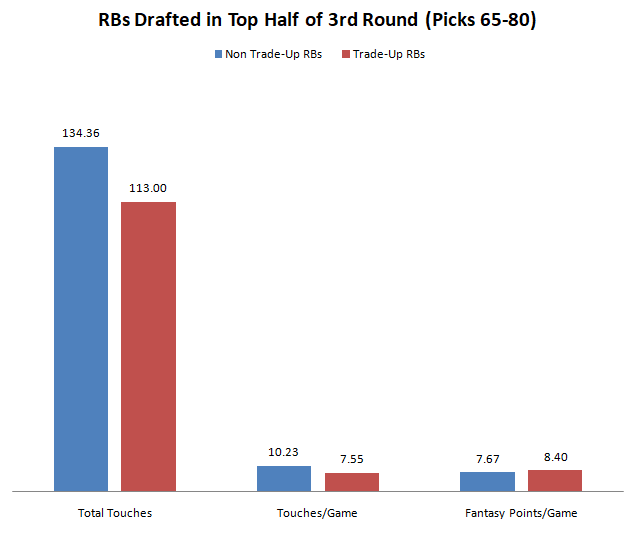
14 running backs were drafted in the top half of the third round (picks No. 65-80) from 2011-2020. Of those 14, three were drafted by teams that traded up. The three backs averaged 113.0 touches during their rookie seasons. They averaged 7.55 touches and 8.40 Fantasy Points Per Game.
Their counterparts from the top half of the third round averaged 134.36 touches during their rookie seasons and 10.23 touches with 7.67 Fantasy Points Per Game.
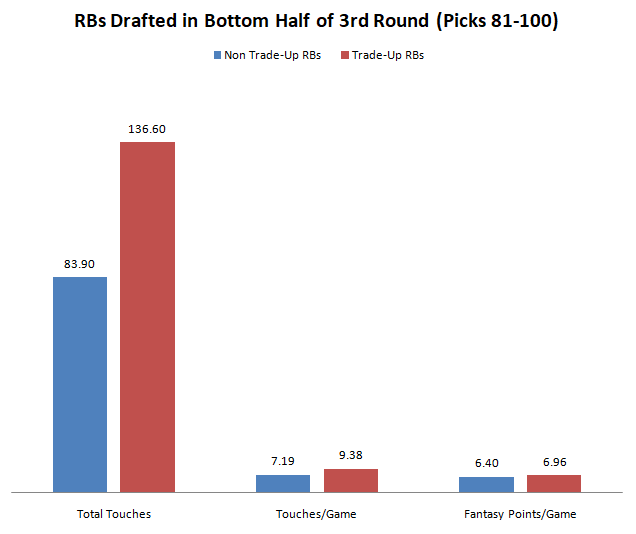
15 running backs were drafted in the bottom half of the third round (picks No. 81-100) from 2011-2020. Of those 15, five were drafted by teams that traded up. The five backs averaged 136.60 touches during their rookie seasons. They averaged 9.38 touches and 6.96 Fantasy Points Per Game.
Their counterparts from the bottom half of the third round averaged 83.90 touches during their rookie seasons and 7.19 touches with 6.40 Fantasy Points Per Game.
Experiment No. 4 Findings
After the top half of the second round, there is not much different from the rest of the Day 2 running backs, whether teams traded up for them or not. The backs drafted in the top half of the third round (but not traded up for) saw more touches than trade-up backs in the top half of the third round (picks No. 65-80) AND the bottom half of the second round (No. 49-64).
Running backs drafted in the bottom half of the third round were not fantasy-relevant, averaging fewer than 7.0 Fantasy Points Per Game during their rookie seasons. A 7.0 Fantasy Points Per Game average would put these rookies outside the top-60 at the position in PPG in 2020.
Javonte Williams
Of all of the Day 2 running backs drafted by teams that traded up since 2011, Javonte Williams was the highest-drafted running back (Pick No. 35). And he’s in excellent company.
The sweet spot for NFL Draft trade-up running backs is the top half of the second round.
There is more though. NFL teams utilize an NFL draft pick trade chart created by legendary football coach Jimmy Johnson. Among Day 2 trade-up running backs, two players were acquired by teams that LOST draft pick value according to the chart: Alvin Kamara and Javonte Williams. The Broncos, like the Saints, pushed their chips into the center on a running back. Safe to bet that they will make sure to feature Williams.
https://www.youtube.com/watch?v=LsyyRQpdzII
If you had doubts about Williams because he’s currently in a timeshare with Melvin Gordon, remember that Kamara had to split time with Mark Ingram and Adrian Peterson during his rookie season. Kamara would proceed to average 19.7 Fantasy Points Per Game, third-highest among the 69 running backs drafted in the top-100 in the past decade as a rookie. Your Salary Cap-tain would like to note that Gordon has an upcoming $2 million in roster bonus money due to him at the start of training camp. He may be moved before this article goes live (editors note: he was not, but still, don’t rule it out yet).
Trey Sermon
The 49ers trading up for Trey Sermon should mean they plan to utilize him at least in a part-time role. Three of the five running backs (60-percent) drafted in the bottom half of the third round by teams that traded up saw at least 115 touches. For comparison, only four of the other 10 running backs (40-percent) drafted in the bottom half of the third round exceeded that mark.
https://www.youtube.com/watch?v=0MmqEp_2imU
The 6.96 rookie Fantasy Points Per Game mark reached by running backs in the bottom half of the third round that were traded up for puts Sermon in handcuff running back territory. Last season, Malcolm Brown (6.8), Alexander Mattison (6.7), and Joshua Kelley (6.3) averaged similar Fantasy Points Per Game.
One interesting fact about Sermon is that he joins an elusive club of third round running backs that teams traded back INTO the third round to acquire; along with. Alvin Kamara (future second), Damien Harris (future fourth plus additional draft capital), and Terrance West (fourth round plus additional draft capital).
Kamara and West would exceed 180 touches during their rookie seasons, while Harris would see 142 touches in his second after essentially redshirting his rookie year.


