This is the first in a series of articles examining the historical fantasy production of a particular position relative to other positions over the past twenty years. That’s right, twenty years.
This is a big picture State of the Union for the running back position. Instead of covering tax reform and health care, it will present colorful charts and exciting statistical trends to help examine the current fantasy world. Prepare to think of football players like assets in a stock portfolio and look at a lot of graphs. There are so many graphs!
Running Backs Aren’t What They Used To Be
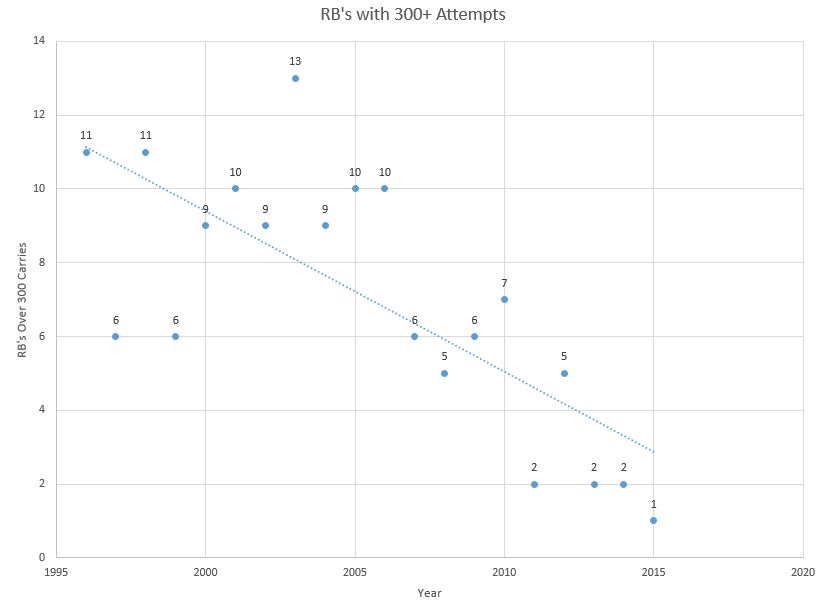
A lot has changed over the past twenty years, and running backs are no exception. The bell cow back is a rare thing in today’s NFL, and the graph below shows that very few running backs now eclipse the 300 carry mark. In fact, if the trend continues, there will be a year very soon where no running back logs more than 300 carries in a season.
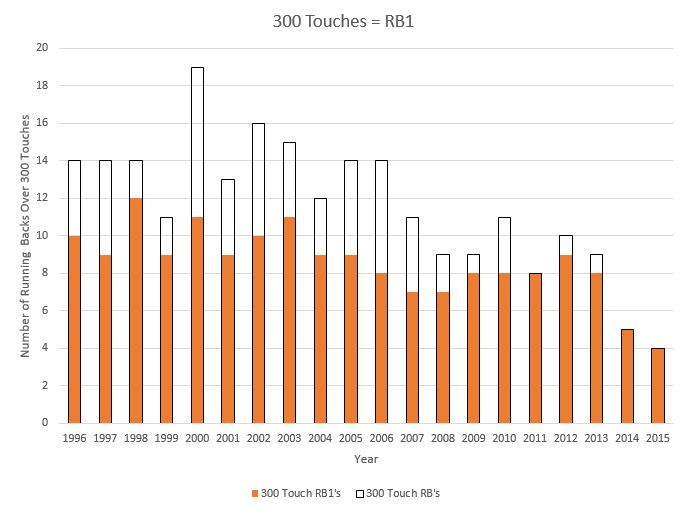
In fact, RB1’s are seeing the ball less in general, not just in terms of carries. The next graph shows that overall touches are decreasing in general, and although it isn’t at a dramatic pace, it’s still a trend to keep an eye on. From 1996 to 2006, there were six years where RB1’s averaged over 350 touches. After 2006, the average never crossed that mark again.
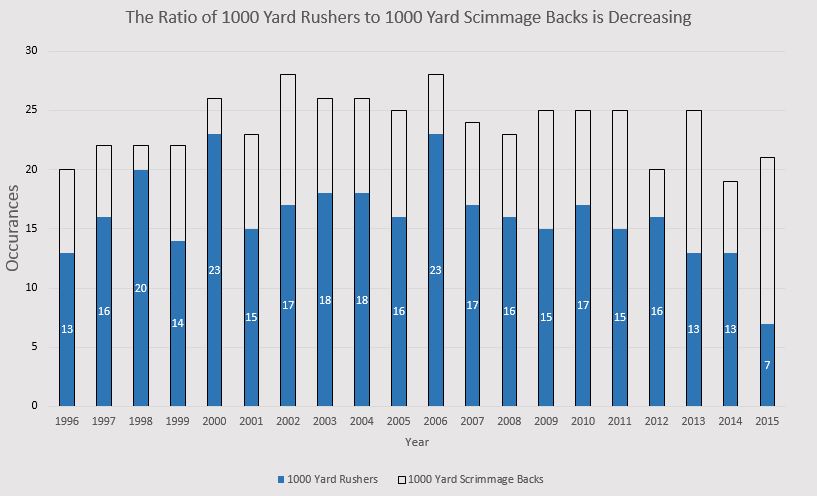
Now, the next thought may be: since these running backs are seeing the ball less, they aren’t gaining the yardage that they used to, right? Actually no, although they lack the touches, modern day ball carriers still consistently go over 1000 total yards from scrimmage. Which is a very important sentence. Illustrated below, 1000 yard rushers are on the decline, but running backs over a thousand scrimmage yards have stayed fairly constant over time.
Granted, there’s been a down turn in the last few years, but the trend isn’t clear and identifiable. There might be an uptick in thousand yard rushers this season after Jonathan Stewart finished No. 8 in the NFL with a mere 989 rushing yards in 2015, but looking at the previous graph, that won’t really be a statistic that matters in terms of overall production. Clearly, running backs are being used differently than they were twenty years ago, and that has certainly changed the outlook of their fantasy production.
Fantasy Production
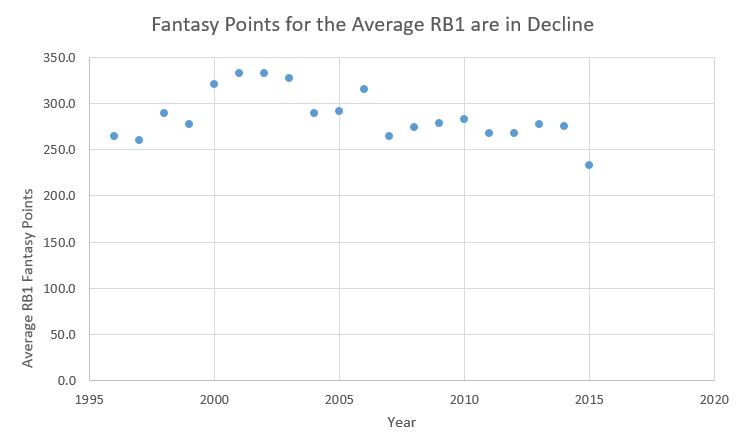
This is why we’re here. How are these running backs fairing in terms of fantasy points? Not great. Even if 2015 is eliminated as a plot point, since it’s so low, the overall trend still shows that RB’s are becoming less valuable.
On top of that, the standard deviation for RB1’s is shrinking as well. The top twelve RB’s are grouping together, scoring closer to their average than they have since 2008. The days of LT outscoring the RB12 by 250 points are over (yes, that really happened). Are there still a few true bell cows? Yes. Stalwarts such as Frank Gore continue to grind. Gore finished No. 3 in the NFL with a 74.3-percent Opportunity Share, but Gore also fell 33 yards short of one thousand. The best fantasy backs in today’s game are still scoring less than their mid 2000 counterparts. It’s likely that we’ve seen the last of the 440-point fantasy backs. Something that happened five out of seven years from 2000 to 2006 has yet to happen again, and that trend isn’t likely to turn around.
RB touches may be decreasing, but accruing 1000 yards from scrimmage is still a common occurrence. This points to the increased effectiveness of current running backs. Average yards per touch are increasing, and so are the average points per touch for RB1’s.
David Johnson posted RB1 numbers on only 161 offensive touches last year, Danny Woodhead did the same with 178 touches. The only other times in the past twenty years that a running back has been within the top twelve and had under 200 offensive touches? Danny Woodhead in 2013 and Darren Sproles in 2011, both fairly recent occurrences. Woodhead and Johnson are incredibly efficient, yes, but this is an obtainable goal now because of the decrease in RB1 scoring. An explosive 160 touch season can vault a relatively unknown ball carrier into the top twelve. RB1’s may be harder to predict season to season now, but the take away here is that their points per touch are increasing. Unlike years past, RB’s who touch the ball 300 times are now guaranteed a spot in the top twelve.
Conclusion
The running back position is a sinking ship, but it’s already close to the bottom. They’re scoring less, they aren’t as involved in the offense as they used to be, and they are becoming less and less predictable. If dynasty is the game, sell young RB’s for WR1’s and reliable veteran backs. The Zero RB strategy caught fire for a reason, wide receivers are becoming the ticket for success, and the next article will show that clearly.


