Zero RB was the en vogue fantasy football draft strategy of the last three season. The argument for avoiding running backs in the early rounds in 2017 was as follows: The RB position is too fragile and volatile to justify a premium draft capital when less fragile, more predictable elite wide receivers proliferated the early rounds of fantasy football PPR leagues. Unfortunately for Robust WR drafters like myself, the top running backs were the primary fantasy football league winners in both 2016 and 2017. Time to re-evaluate. Examining the advanced stats, metrics, and analytics, is Zero RB still the optimal draft strategy for PPR leagues?
Win Rate
Mike Beers from RotoViz.com defined Win Rate as the percentage of league winning rosters on which a particular player appeared. The sheer volume of running backs that appear on the Win Rate leaderboard the past two seasons necessarily prompts a reconsideration of Zero RB strategy. For example, Todd Gurley posted a staggering 30.5-percent Win Rate in 2017, which was 10-percent higher than any wide receiver.
If you take a more general approach to Win Rate, you’ll notice that in the first three rounds of drafting, the average Win Rate is higher if you were to select three RBs as opposed to three WRs. How do you even determine that? It’s rather safe to say the first three rounds of a fantasy football draft are fairly predictable. Sure, some players might vary in ADP, but with enough researching and drafting you will see the same players picked within a certain range. Based on that assumption, we analyzed the top 36 players and their respective Win Rates over the past three years.
In 2015, there was a definite advantage to drafting wide receivers early. Sixteen receivers were typically taken in the first three rounds with an average Win Rate of 10.5-percent. Compared to 16 running backs taken with an average Win Rate of 7.28-percent, the WRs had a pretty distinct advantage. However, we’ve seen the Win Rate percentages shift over the past two years. In 2016, wide receiver Win Rate dipped to 6.4-percent and running back Win Rate increased to 7.8-percent. This past year, generally 14 running backs were selected in the first three rounds, with an average Win Rate of 9.2-percent. The highest over this three year span. Roughly 19 receivers were taken in these same three rounds and on average had an 8.17-percent Win Rate. There appears to be a rather distinct shift from WR to RB in Win Rate advantage.
Position Comparison
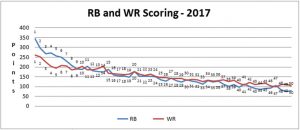
If you run the entire PlayerProfiler database you see that on average, running backs scored almost an entire point more than wide receivers in Fantasy Points Per Game (8.14 verses 7.24). The top six running backs all outscored the best wide receiver. The chart below displays this disparity.
I think this chart is interesting for two reasons. First, it confirms the disparity of the upper tier of running backs versus the upper tier of wide receivers. Secondly, the wide receiver line is much more linear. The drop-off between running back No. 1 and running back No. 10 is much more significant than the drop-off between wide receiver No. 1 and wide receiver No. 10.
The main argument in the past has been, “Well it’s much harder to predict who will be a top running back. There are just too many injuries and the position itself is just too volatile to use a 1st or 2nd round pick.” Injuries are a given. Football is a violent game. Players will get hurt. However, marking a player or a certain position as “injury prone” can lead you into a fantasy trap. Claiming running backs are too tough to predict, though, is simply false. We tend to sensationalize the biggest risers (Alvin Kamara, Kareem Hunt, etc.) and wallow in the worst beats (David Johnson‘s season ending injury). This is what our brain tends to remember entering a new draft year. Surrounding all these outliers, however, is a solid group of predictable top 20 RBs. In 2017, per ESPN consensus pre-season rankings, 14 of the top 20 preseason running backs actually end up as a top 20 scoring running back. In contrast, only 11 of the projected top 20 wide receivers actually finished in the top 20. 2016 wasn’t any better. Both running backs and wide receivers were predicted at the same 55-percent hit rate (11 out of 20), showing that it is equally difficult to predict the top wide receivers. Additionally, there are several factors that will work against wide receivers in 2018 to further deflate their value.
RB Pass Catching
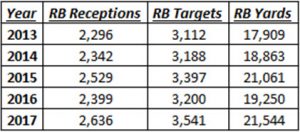
In 2017, running backs as a whole totaled 2,636 receptions, 3,541 targets and 21,544 total receiving yards. Over the past five years, running back involvement in the passing game has steadily increased. More offensive coordinators are looking towards the running back as a featured pass option, and not just on 3rd down.
NFL teams seemed to have discovered that it is more efficient to target a running back on first down than it is a wide receiver. According to Warren Sharp’s 2017 Football Preview, running back passing game success rate was 3-percent higher than wide receivers in 2017. Furthermore, the QB interception rate when targeting running backs on 1st down and ten was 250-percent lower than the corresponding wide receiver interception rate in the same game situation. You would expect more efficient play calling to lead to more efficient players, and it did based on running back Production Premiums available in the PlayerProfiler database. In 2016, the top 20 running backs had an average Production Premium of +4.4 while in 2017 it increased to +5.5.
It makes sense that in real football terms and in fantasy terms, you want a running back who is elite at both running and catching. That is what makes running backs like Le’Veon Bell, David Johnson and Todd Gurley so special. Of the top 10 running backs in 2017, on average, 26-percent of their fantasy points came from receiving yards/TDs. That means you could tack on an extra four points per week to their total box score just on pass catching alone. So what does this all have to do with wide receivers? The law of conservation of targets, of course. As we see an increase in Target Share for running backs, this will inevitably decrease the Target Share of the entire wide receiver corp, ultimately deflating their fantasy value.
Rise of the Slot Receiver
The rise of the slot receiver has been a critical factor diminishing the overall value of the fantasy WR1 wide receiver tier, and the disproportionate contribution of slot receivers to NFL passing games projects to grow in 2018. Reviewing the receivers with the highest slot rates in 2017, most were not 1st or 2nd rounders. Generally those 1st and 2nd round picks are reserves for traditional split end/X receivers from Julio Jones to Mike Williams, who spend little time in the slot. If this observation holds true, it will have a direct negative correlation to the flanker receivers, deflating their value by taking away precious Target Share.
https://www.youtube.com/watch?v=C37I1BwnFHc
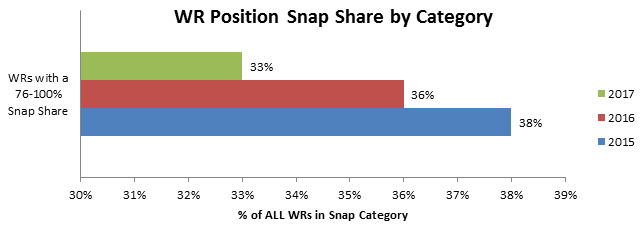
The PlayerProfiler database also proves this offensive shift to be true by examining the Snap Share of wide receivers over the past three years. If you look at the wide receivers as a whole you will see the shift from dominant receivers getting all the snaps (76- to 100-percent snap share), to a more balanced approach with more receivers competing for snaps. You can see this big jump from 2015 to 2017 where in 2015, 38-percent of the receivers were getting somewhere between 76- and 100-percent of the Snap Share. In 2017, it is down to 33-percent, smoothing out fairly significantly over a short time frame. This evolution of the NFL offense does not bode well for fantasy receivers. You want your receiver to get as many snaps as possible and anything less will diminish potential returns.
Tight End Surge
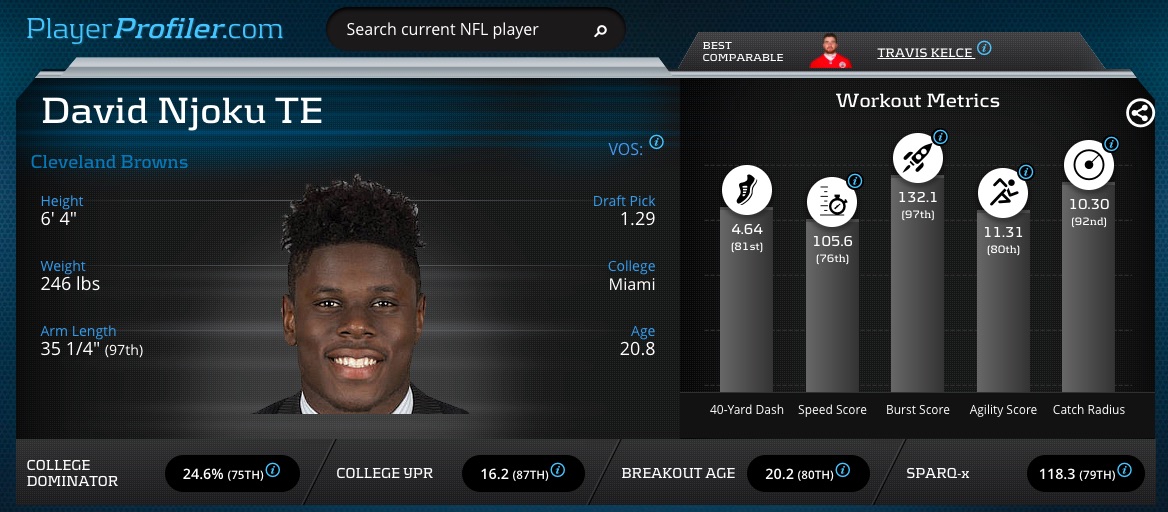
2017 was the first time in 15 years we saw three tight ends taken in the first round of the NFL Draft. These tight ends aren’t being drafted on their blocking skills anymore; these players are being drafted based on their passing catching prowess. Teams are wising up to the defensive mismatches the tight end creates so you can see why more teams are gravitating to these big, athletic tight ends. It wouldn’t be surprising to see players like Travis Kelce and David Njoku start to become focal points in their offense.
David Njoku Advanced Stats & Metrics Profile
When considering the tight end position in terms of usage it is important to go a step further from Snap Share to weed out any plays tight ends are strictly used for blocking. If you are to review the PlayerProfiler database of tight end Pass Routes Per Game and compare this to Team Pass Plays you will notice NFL teams on average run 36.5 pass plays a game while the tight ends run about 42 pass routes a game. Not only are tight ends out there running a pass route every play but most teams are incorporating two tight end packages into their offense. The New England Patriots, known for being a perennial top offense ran a whopping 81 tight end pass routes per game compared to only an average of 39 pass plays a game! As more offenses realize the potential for increased efficiency by designing pass plays towards the tight end position the less value wide receivers will hold in the fantasy football universe.
Conclusion
As I was writing this, I saw a well-known fantasy analyst tweet out something that perfectly emphasized our point. It said; “Nothing more valuable than an elite back. The trick is landing yourself said elite back and him staying upright. Very Hard.” We have been engrained to think of running backs as draft land mines, so we have avoided them at all costs. I’m not saying Zero RB is a bad strategy, but it’s also a nice way to land yourself 2nd or 3rd place every year. Second place might be fine for some folks out there, but I’m trying to win my league. Second place, 5th place, dead last; they all have one thing in common: they are not 1st place. Of course there are some exceptions to every strategy. If Antonio Brown is sitting there in the middle of the 1st round, you obviously take him. However, the owners who draft that anchor running back are the ones hoisting the trophy every year. My goal is give myself the best shot (or two, or three) at landing that running back, and if I end up in last place due to injuries, so be it. I’m going to grab my RBs in the first three rounds and draft quality wide receivers in the later rounds using quality predicative analytics like Breakout Age and College Dominator Rating.
I’ll see you all at the winner’s podium.


